D3.js Tutorial
Second Part
A tutorial by Dominik Moritz (@domoritz) and Kanit "Ham" Wongsuphasawat (@kanitw)
Interactive Data Lab, University of Washington
(Based on Vadim Ogievetsky and Scott Murray's work)
Interactions
Event Listeners
.on('mouseover',...), .on('click',...)
Note 1: :hover pseudo-selector also works with svg!
Note 2: To remove a listener, pass null as the listener. To remove all listeners for a particular event type, pass null as the listener, and .type as the type, e.g. selection.on(".foo", null).
SVG Tooltips
Last week, we did it in svg.
SVG Tooltips
HTML Tooltips
See "Div Tooltip HTML" in Murray
Brushing - d3.svg.brush()
From http://bl.ocks.org/mbostock/4063663. See also Focus+Context
Scale
Domain ↦ Range
function x(d) {
  return d * 42 + "px";
}
http://www.jeromecukier.net/blog/2011/08/11/d3-scales-and-color/
.linear()
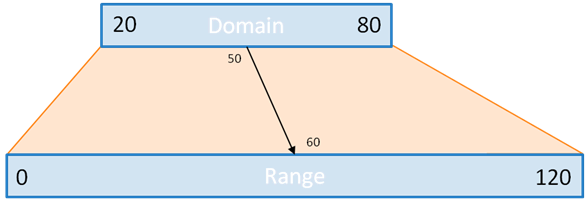
var x = d3.scale.linear().domain([0, 10]).range([0,100]);
console.log(x(-1),x(0), x(4.4), x(10), x(11)); //-10 0 44 100 110 with some rounding errors
console.log(x.clamp()(-1), x.clamp()(11); // 0 100
Scale methods
.nice()round domain to nicer numbers e.g. from[0.2014, 0.9966]to[0.2, 1]d3.scale.linear().domain([0.2014,0.9966]).nice().domain() // [0.1,1].rangeRound()output range in integers – better for positioning marks on the screend3.scale.linear().domain([0, 10]).range([0,100])(0.1234)// 1.234 d3.scale.linear().domain([0, 10]).rangeRound([0,100])(0.1234)// 1.invert()d3.scale.linear().domain([0, 10]).range([0,100]).invert(50); //5.ticks()return uniformly spaced ticks for your axes. (See Axes for examples).clamp()limit output to range if an input outside the domain is provided
Scales supports various interpolations!
Color
var x = d3.scale.linear()
    .domain([12, 24])
    .range(["steelblue", "brown"]);
x(16); // #666586
x.interpolate(d3.interpolateHsl)(16); //#3cb05f
Size
var x = d3.scale.linear()
    .domain([12, 24])
    .range(["0px", "720px"]);
x(16); // 240px
Other Scales
d3.scale.log(), d3.scale.pow(), d3.scale.quantile()
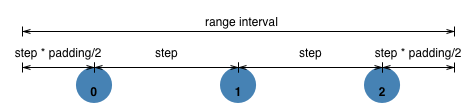
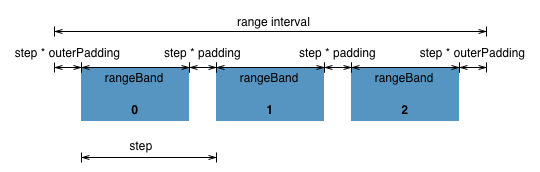
Ordinal Scales
d3.scale.ordinal()
ordinal.rangePoints(interval[, padding]) – e.g. Plots
ordinal.rangeBands(interval[, padding[, outerPadding]]) - e.g. Bar Chart
Categorical Color Scale
.category10()
#1f77b4 #ff7f0e #2ca02c #d62728 #9467bd #8c564b #e377c2 #7f7f7f #bcbd22 #17becf
SVG Axes
//Create an axis for a given scale, and configure as desired.
var xAxis = d3.svg.axis()
    .scale(x)
    .orient("bottom"); // returns a function!

svg.append("g")
      .attr("class", "x axis")
      .attr("transform", "translate(0," + height + ")")
      .call(xAxis); //rendering axis with call
Need customization!
.axis path, .axis line {
  fill: none;
  stroke: #000;
  shape-rendering: crispEdges;
}
See Bar Chart example
Path Generators & Line Interpolators
Charts from http://bost.ocks.org/mike/d3/workshop/#124d3.svg.line(), d3.svg.area()
D3 provides helpers to generate SVG lines and areas.
Linear Interpolation
Step Interpolation
Step-before and step-after interpolation are handy for bar charts, and for visualizing step functions (values that change instantaneously rather than gradually).Basis Interpolation
Note that with basis interpolation, the line doesn’t always go through the control point. D3 also provides cardinal and cubic monotone interpolation; the latter is generally preferred to avoid misleading.Layouts & Maps
Pie
Many layouts are just data generators/modifier.
Source: Chapter 11 in Interactive Data Visualization for the Web by Murray
Force Directed
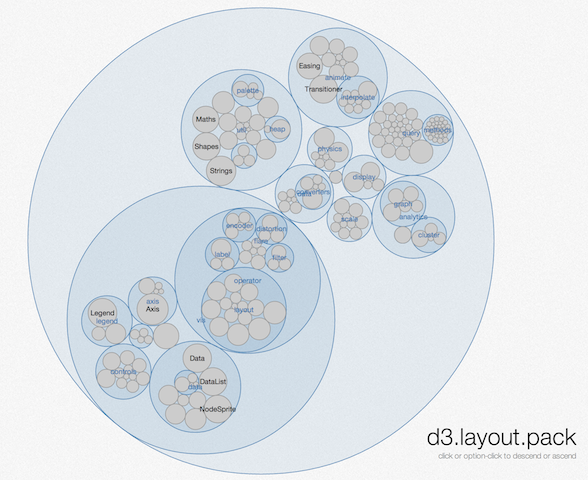
Pack
Tree
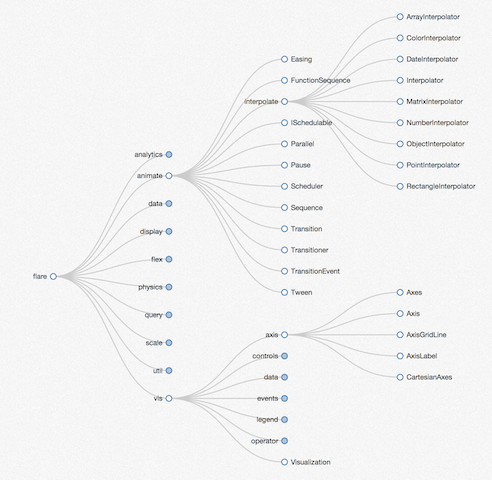
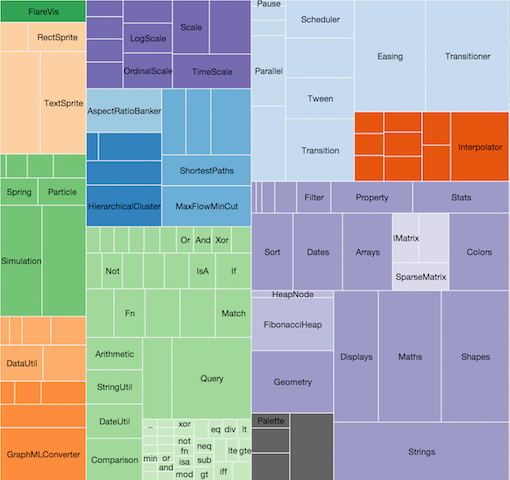
Treemap
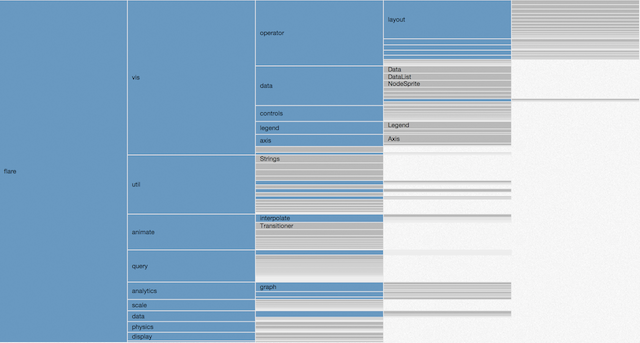
Partition
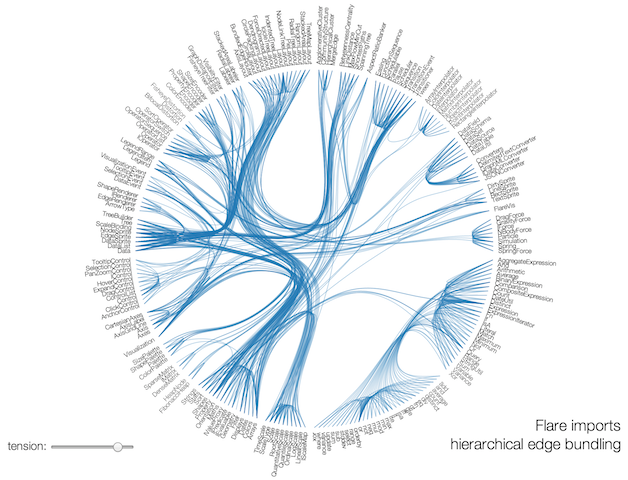
Bundle
Voronoi
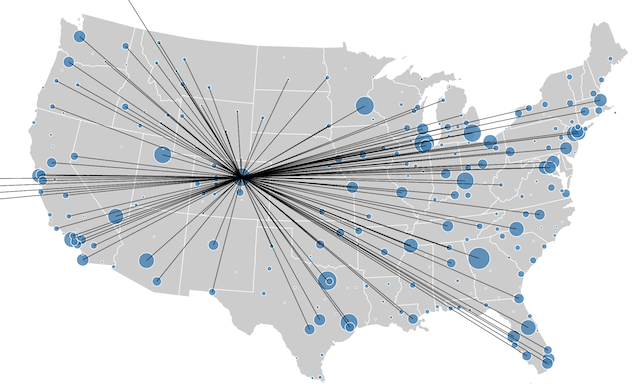
Maps
http://bost.ocks.org/mike/map/Load data: d3.csv(), d3.tsv(), d3.json()
Implemented Using XMLHttpRequest
var format = d3.time.format("%b %Y");

d3.csv("stocks.csv", function(d) {
return {
  price: +d.price,  // convert price to number
  date : format.parse(d.date)
};
}, function(error, rows) {
console.log(rows);
});
Note: A web server is required when loading external data. For example with python -m SimpleHTTPServer
Useful Tips
Reusable d3.
Repeatable, Modifiable, Configurable, Extensible
- Mike Bostock's Towards Reusable Charts
- Mike Pennisi Exploring Reusability with D3.js
Need in memory database?
Datavore CrossfilterLet's Build a Chart!
Use transforms to define a new origin.
It's always a good idea to sketch the transforms before you start.
From http://bost.ocks.org/mike/d3/workshop/#107