UW Interactive Data Lab
papers
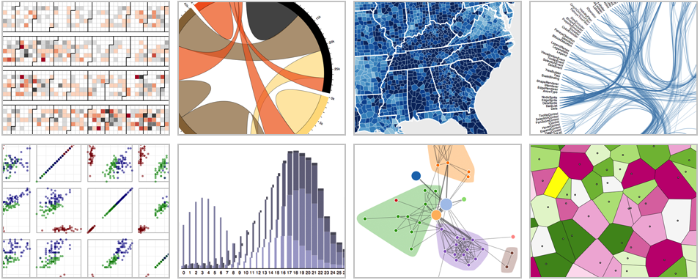
D3: Data-Driven Documents
Michael Bostock, Vadim Ogievetsky, Jeffrey Heer.
IEEE Trans. Visualization & Comp. Graphics (Proc. InfoVis), 2011
IEEE Trans. Visualization & Comp. Graphics (Proc. InfoVis), 2011
Abstract
Data-Driven Documents (D3) is a novel representation-transparent approach to visualization for the web. Rather than hide the underlying scenegraph within a toolkit-specific abstraction, D3 enables direct inspection and manipulation of a native representation: the standard document object model (DOM). With D3, designers selectively bind input data to arbitrary document elements, applying dynamic transforms to both generate and modify content. We show how representational transparency improves expressiveness and better integrates with developer tools than prior approaches, while offering comparable notational efficiency and retaining powerful declarative components. Immediate evaluation of operators further simplifies debugging and allows iterative development. Additionally, we demonstrate how D3 transforms naturally enable animation and interaction with dramatic performance improvements over intermediate representations.
BibTeX
@article{2011-d3,
  title = {D3: Data-Driven Documents},
  author = {Bostock, Michael AND Ogievetsky, Vadim AND Heer, Jeffrey},
  journal = {IEEE Trans. Visualization \& Comp. Graphics (Proc. InfoVis)},
  year = {2011},
  url = {https://uwdata.github.io/uwdata/papers/d3},
  doi = {10.1109/TVCG.2011.185}
}